
Camel milk protein: how to compare published figures
Pinned 2026-11-07
Posted 2026-11-07
Posted after the board's automated content and source checks passed on 2026-11-07 · Health notice
In short
Compare published camel milk protein figures by checking the samples, reporting units and measurement methods. Learn how water content, protein fractions and missing data affect the comparison.
Sheet 01 of 11
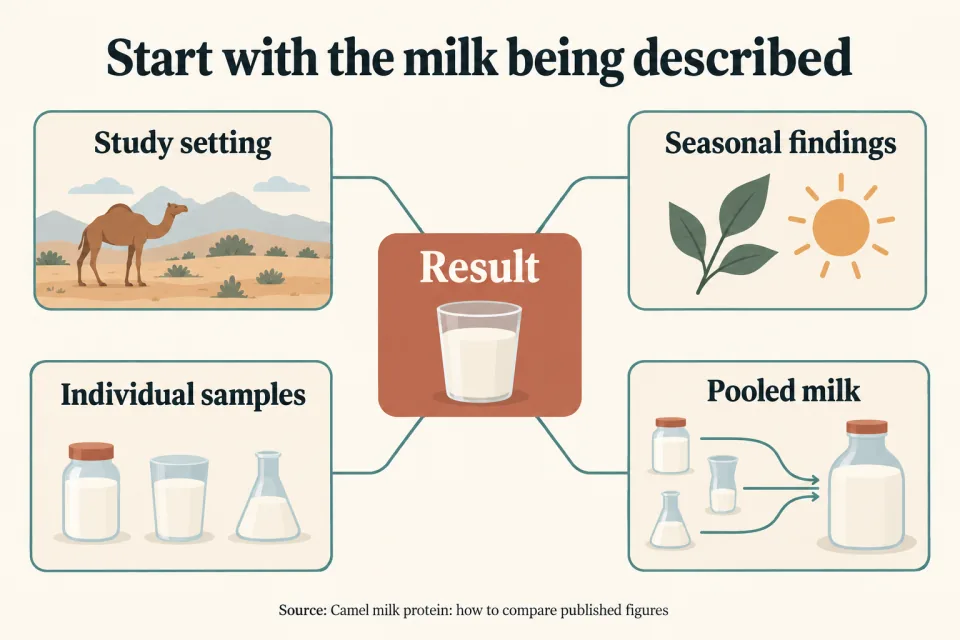
Start with the milk being described
- Published camel milk protein figures need matching food descriptions, measurement methods and reporting bases before they can be compared. A heading that says only camel milk leaves much of that work unfinished. Read the description of the material analysed alongside the result.
- The Food and Agriculture Organization of the United Nations (FAO) identifies food identity and preparation state as part of assessing composition data. For a comparison, record the milk description exactly as the source gives it. Keep any preparation details beside the figure, rather than separating them into notes that disappear when the figure is copied.
- Species belongs in that description. The camel milk meta-analysis published in 2009 brought together 82 references from scientific journals and grey literature. Its evidence covered both dromedary and Bactrian milk, so the pooled material was broader than milk from a particular local flock.
- Begin a comparison record with the food name, species where stated, preparation state and original source. Then add the protein result with its complete heading. This sequence follows the information needed to establish what the result describes before considering whether it belongs beside another result.
Sheet 02 of 11
Keep the study setting attached to the result
- The origin of a milk sample is part of the meaning of its protein figure. FAO's sampling guidance distinguishes natural differences associated with geography, season and husbandry from differences introduced by analytical conditions. These details belong beside the result when comparing publications.
- The camel milk meta-analysis examined geographical origin and publication year as sources of variation. Its authors suggested that the predominance of Bactrian camels could help explain higher concentrations of most components in the Asian references. That explanation was a suggestion about the evidence they assembled, rather than a finding that geography alone determined composition.
- Preserve that distinction when writing comparison notes. Record the place and the species separately, even when they appear together in the source. Combining them into a broad regional label would discard information that the authors themselves considered relevant to interpreting their results.
- The same approach applies to husbandry. If a paper identifies a pastoral setting, carry that description forward with the sample information. A useful comparison keeps the setting visible without turning it into an explanation the study did not establish. This makes the difference between describing the sampled milk and making a wider claim about camel milk.
Sheet 03 of 11
Read seasonal findings within their study
- Seasonal findings describe the milk sampled in the named study. The Tunisian investigation provides a concrete example because it identifies the animals, management setting and sampling seasons. Its results can be read with those boundaries still attached.
- The Tunisian study sampled milk from 69 Maghrebi camels in private flocks managed traditionally during winter and summer. The research concerned pastoral flocks in Tunisian oases. Within those flocks, the highest protein and casein concentrations occurred in winter.
- The same study's protein and casein findings describe milk collected under traditional pastoral management. This management setting is another sample detail to record alongside season. It does not turn the winter finding into a statement about every camel or every setting.
- For a practical comparison, place the seasonal result beside the description of the flocks and their management setting. When another paper reports a different protein figure, compare those descriptions before attributing the difference to a season. FAO's sampling guidance separates natural variation from analytical variation, so the laboratory methods also remain part of the comparison.
- A concise note can retain the study's meaning by saying that the winter finding concerned the sampled Tunisian flocks. Keep that local wording when using the finding elsewhere.
Sheet 04 of 11
Distinguish individual samples from pooled milk
- Individual and composite samples provide different information about variation. FAO describes a composite sample as a mixture of primary samples. It also explains that analysing primary samples separately provides information about variation that can support confidence limits around a mean.
- Look for the sampling description before interpreting an average. Record whether the laboratory analysed samples separately or combined them. A reference to a milk sample, without this detail, should prompt a closer reading of the sampling section rather than an assumption about how the material was prepared.
- The way a composite is assembled also matters to its description. FAO explains that composites may combine equal weights or use weights that reflect different sampling groups. Preserve that distinction in the comparison record, because the mixture represents the contributions described by its sampling design.
- FAO warns that sampling only conveniently accessible sources can give a misleading picture of food composition. Its sampling guidance also calls for representative material and preservation of composition between collection and analysis. These concerns connect the collection process to the meaning of the final laboratory result.
- A useful sampling note therefore covers the source of the milk, whether samples were kept separate or combined, and how the collection was intended to represent the food. Keep sample counts with these details, rather than using the count alone to judge the evidence.
Sheet 05 of 11
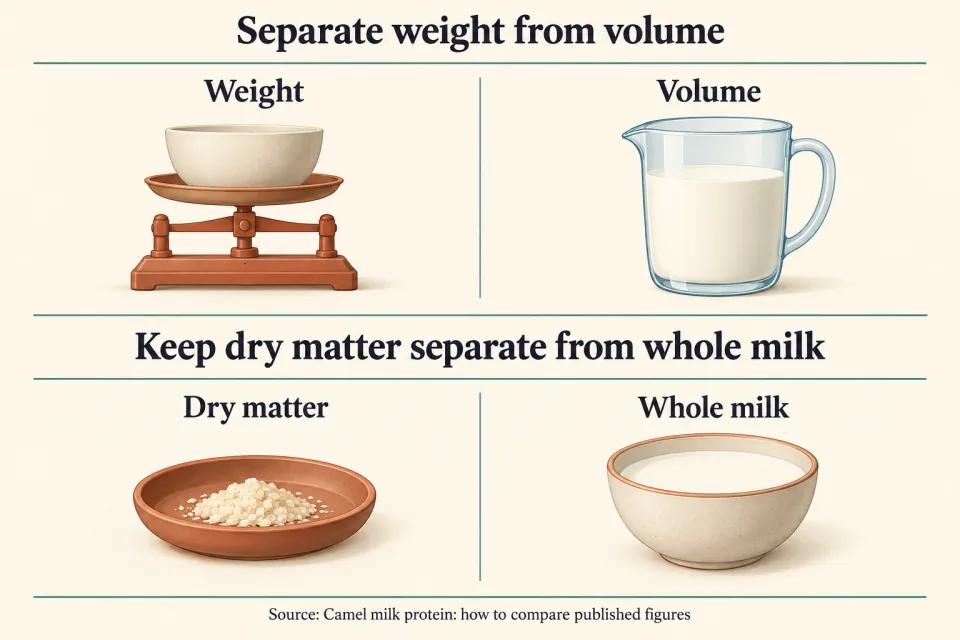
Separate weight from volume
- A result expressed by milk weight has a different reporting basis from a result expressed by milk volume. FAO's guidance on expressing composition data identifies density as necessary for converting appropriately between these bases. Matching the word protein in the headings is only part of the comparison.
- Read the complete unit and identify what the amount of protein is divided by. A mass basis refers to a weight of milk; a volume basis refers to a volume of milk. Copying the nutrient amount while dropping that denominator removes the information needed to interpret the concentration.
- For a comparison organised by weight, retain the weight-based entry as reported. A volume-based entry needs a documented density conversion before it can be placed on that same basis. Keep the original entry alongside any converted version so the change in reporting basis remains visible.
- The reverse applies when organising the comparison by volume. Choose the common basis deliberately, then record the information used to reach it. FAO's emphasis on reporting conventions makes this a question of how the data are expressed, separate from the question of how the protein was measured.
- This check is especially useful when a copied table has shortened column headings. Return to the full heading and its notes before transferring the entry into a comparison.
Sheet 06 of 11
Keep dry matter separate from whole milk
- A dry-matter protein figure and a whole-milk protein figure describe different reporting bases. FAO's composition guidance explains that measured water content connects dry-matter results with fresh-weight results. Its camel milk reference also identifies water content as a major influence on overall composition.
- Read dry matter as part of the unit description, even when it appears in a footnote rather than the column heading. It identifies the material used as the denominator. Removing that label while retaining the figure would change what the entry appears to describe.
- Converting a dry-matter result to a fresh-weight basis requires the measured water content of the same sample. Keep the moisture result attached to the protein result during that calculation. FAO also identifies documentation of conversion factors as part of recording how composition values were calculated.
- For a working comparison, record the original basis, the water measurement and the calculation method together. This creates a traceable connection between the published result and the converted entry. It also keeps the conversion separate from any differences in the milk samples themselves.
- Treat whole-milk concentration and dry-matter concentration as separate questions while reading. Establish which question each paper answers before deciding how to align its result with another paper.
Sheet 07 of 11
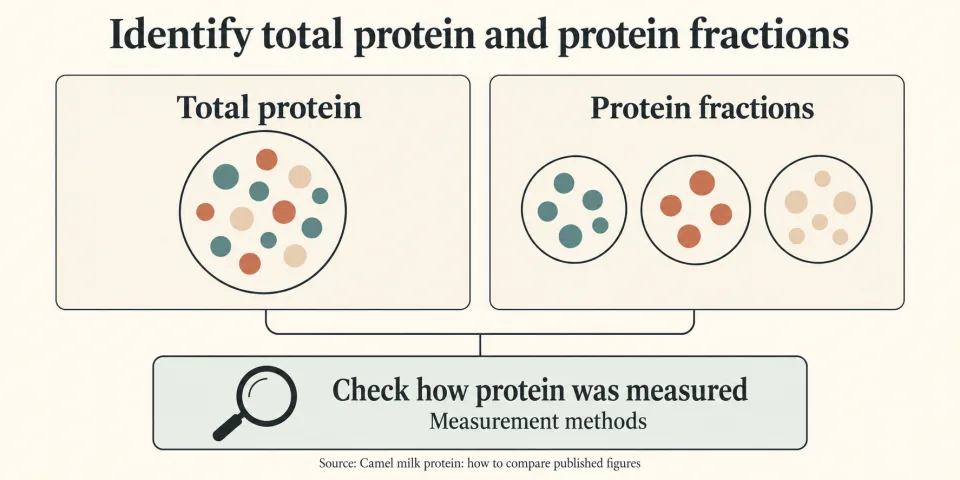
Identify total protein and protein fractions
- Total protein, protein fractions and amino acid data need separate labels in a comparison. FAO's camel milk reference discusses casein and whey proteins as distinct fractions. Its reporting guidance also explains that amino acid data may use protein or nitrogen as the denominator instead of the weight of the whole food.
- Begin by identifying the named component. If the entry concerns casein, keep casein in the comparison heading. If it concerns whey proteins, retain that wording. A label that reduces every such entry to protein would discard the distinction made in the composition source.
- Then inspect the denominator independently. An amount expressed relative to protein answers a different compositional question from an amount expressed relative to the whole milk. The component name and denominator therefore need to travel together when a result is copied or discussed.
- For example, a whole-milk protein entry belongs under a heading describing protein concentration in milk. A fraction entry belongs under its named fraction, with its own reporting basis preserved. This arrangement lets the reader see what each entry measures without requiring an unsupported conversion between them.
- The same reading method applies to amino acid tables. Identify the amino acid, then identify whether the reported amount refers to milk, protein or nitrogen. Do that before comparing figures from separate tables.
Sheet 08 of 11
Check how protein was measured
- Protein figures can come from different analytical approaches. FAO's account of food analysis distinguishes nitrogen-based estimates from amino acid analysis. The method description explains how the reported protein result was obtained.
- A common approach uses Kjeldahl analysis to measure nitrogen and then applies a conversion factor to estimate protein. Food nitrogen also occurs in compounds other than proteins. FAO further explains that the nitrogen proportion of a protein depends on its amino acid composition, which helps explain the use of food-specific conversion factors.
- For a nitrogen-based result, record both the analytical method and the conversion factor used by the authors. Keep those details with the result rather than treating the word protein as a complete description of the measurement. The calculation method is part of the route from the laboratory measurement to the published entry.
- Amino acid analysis offers another route to determining protein instead of estimating it from total nitrogen. FAO explains that this approach avoids assumptions about non-protein nitrogen, while requiring more elaborate equipment than Kjeldahl analysis. These are differences in analytical approach, not a basis for silently replacing a paper's reported result.
- When preparing a comparison, preserve the method names and calculation details in separate fields. That allows a difference in sample composition to be considered alongside a difference in measurement method, rather than combining them into an unexplained disagreement.
Sheet 09 of 11
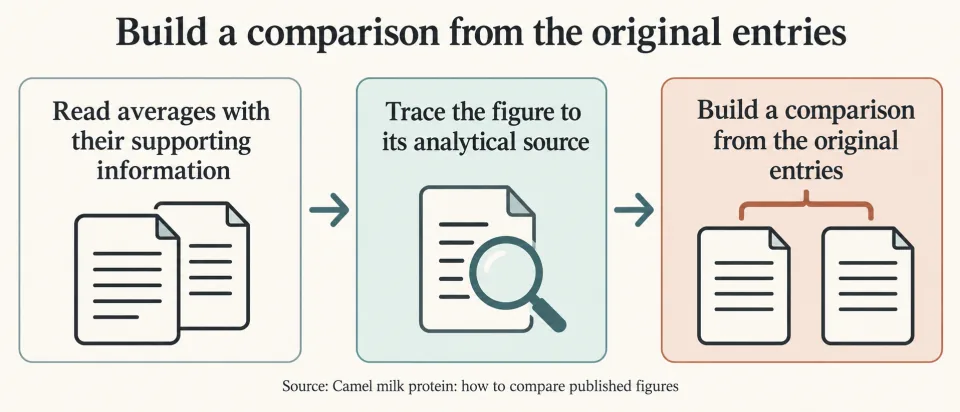
Read averages with their supporting information
- An average is easier to interpret when the sample count and information about variation remain beside it. FAO's formats for detailed composition tables include the mean, standard deviation or standard error, and sample count. Preserve the source's labels when transferring these details.
- A compact comparison can place the reported mean next to its accompanying measure of variation. Keep standard deviation and standard error under their original names. The purpose is to retain the statistical description the source provides, rather than reducing the result to a detached central figure.
- Numerical precision also needs care. FAO links the appropriate number of significant digits to analytical precision and natural variation in the food. Extra decimal places should therefore be considered alongside both factors, rather than used as a shortcut for judging the quality of a camel milk figure.
- FAO's reporting guidance says that a missing composition value must not be entered as zero. It also says that estimates borrowed from similar foods should be identified and documented as imputed values. Keep those labels visible in the same place as the entry.
- In practice, use separate wording for a measured result, a missing entry and an imputed estimate. This preserves the status of the evidence while allowing the entries to remain in a shared comparison record.
Sheet 10 of 11
Trace the figure to its analytical source
- A composition figure needs a traceable source as well as a clear unit. FAO's guidance on compiling composition databases explains that a compilation may cite another table instead of leading directly to the original analytical results. Follow that chain when assessing what a published entry represents.
- The same guidance identifies food identity, analytical procedures and reporting basis as parts of assessing published figures. Gather those details from the source that describes the analysed material. A short abstract or a copied table may serve as a starting point for locating the fuller account.
- FAO advises examining full papers rather than relying on abstracts as sources of composition values. For a comparison record, retain the original analytical source separately from any later compilation in which the figure appears. This gives each reference a clear role.
- Publication date also needs context. FAO cautions that newer measurements alone do not justify discarding older values without evidence of changed foods or improved analytical procedures. Compare the documented material and methods before using publication order to choose between entries.
- This source check completes the earlier checks on samples and units. It connects the number being discussed to the document that explains its origin.
Sheet 11 of 11
Build a comparison from the original entries
- A useful comparison preserves the original entries and records each change needed to align them. Start with the food description and source, then add the complete protein label and reporting basis. Keep the sampling and analytical details beside that information.
- Consider an entry reported by milk volume alongside an entry reported by milk weight. The next task is to establish the density information needed for conversion. If an entry instead refers to dry matter, the relevant bridge is the measured water content of that sample. These situations call for different information, even though both concern reporting bases.
- Now consider an entry labelled casein beside an entry labelled total protein. Retain their component names and inspect their denominators before placing them together. A change of weight or volume units would not address the difference in what the entries describe.
- After resolving the component and basis, compare the sample descriptions. Keep a seasonal finding from the Tunisian flocks attached to those flocks, and keep the broader species coverage of the literature meta-analysis visible. Add the analytical method and any documented conversion factor to complete the account of how each result was obtained.
- Finally, carry across the reported variation and the status of each entry. The resulting comparison explains which differences concern the milk, which concern measurement and which concern reporting. Its value comes from making those distinctions explicit while preserving the published evidence.
Sources for this notice
The composition of camel milk: a meta-analysis of the literature dataEffect of nongenetic factors on milk compositional aspects and bacteriological quality in Tunisian Maghrebi dromedaries (Camelus dromedarius) reared under a traditional pastoral management systemThe technology of making cheese from camel milk (Camelus dromedarius): IntroductionFood Composition Data, Chapter 9: Conventions and modes of expression of food composition dataFood Composition Data, Chapter 4: Selection of nutrients and other componentsFood energy: methods of analysis and conversion factors, Chapter 2: Methods of food analysisFood Composition Data, Chapter 5: SamplingFood Composition Data, Chapter 10: Quality considerations in the compilation of a food composition database
Desk file
On file for this notice
- Credited to
- Health Protein
- Backed by
- 8 sources listed above
Short notices on the protein in everyday foods from around the world, from dal, paneer and lentils to eggs, fish, yogurt and quinoa. One food per notice, every number sourced.
About this board · How notices are checked · Health notice · People on this board · Expert panel · Privacy notice · Contact the board · Grievances desk